ELK Log Collection Methods: The Complete Guide for Security Teams
Enterprises generate terabytes of logs each day from endpoints, cloud services, and operational technology (Mordor Intelligence). Your ELK stack is only as valuable as the data you feed it. Without a solid log collection strategy, you're building threat detection on a foundation of gaps.
If you want to learn more about what ELK Stack is then follow the article here
This guide covers the different ELK log collection methods and getting security data into your ELK stack: agentless collection via syslog, agent-based collection using Elastic Beats, and API-based integration for cloud and SaaS platforms. By the end, you'll understand which approach fits your environment and how to combine methods for comprehensive visibility.
If you haven't set up your ELK stack yet, start with our ELK Stack Security Monitoring Tutorial to get Elasticsearch, Logstash, and Kibana running in Docker.
The Three Collection Methods We Will Explore
Every log source falls into one of three categories based on how you get data from it:
| Method | Installation Required | Best For | Data Richness |
|---|---|---|---|
| Agentless (Syslog) | None on source device | Network devices, firewalls, appliances | Standard log formats |
| Agent-Based (Beats) | Yes, on each endpoint | Servers, workstations, containers | Deep system visibility |
| API-Based | None, but requires credentials | Cloud platforms, SaaS applications | Cloud-native events |
Most production environments use all three. Network devices send syslog, servers run Beats agents, and cloud platforms connect via API. The key is matching the right method to each log source.
Agentless Collection: Syslog
Syslog is the universal language of log forwarding. Nearly every network device, security appliance, and Linux system can send syslog messages to a remote collector without installing any additional software.
How It Works
Your Logstash instance listens on port 514 (or another port you configure). Source devices are configured to forward their logs to your Logstash IP address. The data flows over UDP or TCP with no agent installation required on the source.
What Supports Syslog
- Firewalls: Palo Alto, Fortinet, Cisco ASA, pfSense, OPNsense
- Routers and Switches: Cisco, Juniper, Ubiquiti, Aruba
- Linux Servers: rsyslog, syslog-ng (built into most distributions)
- Security Appliances: IDS/IPS systems, web application firewalls, load balancers
- IoT and OT Devices: Many industrial control systems and network-connected devices
Pros and Cons
Advantages:
- Zero installation on source devices
- Works with legacy systems and appliances you can't modify
- Simple configuration (just point to an IP address)
- Low overhead on source devices
Limitations:
- Limited to what the device chooses to log
- UDP can drop packets under heavy load (TCP syslog solves this)
- Less granular than agent-based collection
- No file integrity monitoring or process-level visibility
When to Use Syslog
Syslog is your primary method for network infrastructure. Firewalls, routers, and switches don't support agent installation, so syslog is often the only option. It's also ideal for quick wins: if your home router supports syslog forwarding, you can start collecting real security data in minutes.
For detailed setup instructions, see our upcoming guide: Syslog Collection for ELK Security Monitoring.
Agent-Based Collection: Elastic Beats
Beats are lightweight data shippers developed by Elastic. Unlike syslog, which relies on the source device's built-in logging, Beats agents actively collect data from the systems where they're installed, giving you much deeper visibility.
The Beats Family
| Beat | What It Collects | Security Use Cases |
|---|---|---|
| Filebeat | Log files | Authentication logs, application logs, syslog files |
| Winlogbeat | Windows Event Logs | Failed logins (4625), privilege escalation, PowerShell execution |
| Auditbeat | Linux audit events, file integrity | File changes, process execution, user sessions |
| Packetbeat | Network packet metadata | DNS queries, HTTP transactions, connection tracking |
| Metricbeat | System and service metrics | CPU, memory, disk (cryptominer detection) |
How It Works
You install the appropriate Beat on each system you want to monitor. The Beat reads local data sources (log files, event logs, system metrics) and ships them directly to Elasticsearch or through Logstash for additional processing. Beats handle buffering, compression, and delivery confirmation automatically.
Check the Linux basics article for ideas on the filesystem and important directories
Pros and Cons
Advantages:
- Deep visibility into endpoint activity
- Structured data with Elastic Common Schema (ECS) compliance
- Built-in modules for common log formats (reduces parsing work)
- File integrity monitoring with Auditbeat
- Backpressure handling prevents data loss during network issues
Limitations:
- Requires installation on each endpoint
- Management overhead increases with scale (consider Fleet for central management)
- Not suitable for network appliances that don't support software installation
- Resource consumption on monitored systems (though minimal)
When to Use Beats
Beats are essential for endpoint visibility. If you need to monitor authentication on Linux servers, track Windows security events, or detect file system changes, Beats are the industry standard approach.
For most security monitoring deployments, start with:
- Filebeat on Linux servers (collects /var/log/auth.log, syslog)
- Winlogbeat on Windows servers and workstations (Security Event Log)
- Auditbeat where you need file integrity monitoring
For detailed setup instructions, see our upcoming guides: Filebeat for Linux Security Logs and Winlogbeat for Windows Event Collection.
API-Based Collection: Cloud and SaaS Integration
Cloud platforms and SaaS applications don't run on infrastructure you control. You can't install agents on AWS or Microsoft 365. Instead, these services expose APIs or event streams that Filebeat modules can consume. It would be interesting to collect data from tools like Azurehound and many more.
Common Cloud Log Sources
| Platform | Log Type | Collection Method |
|---|---|---|
| AWS CloudTrail | API activity, authentication | Filebeat AWS module or S3 input |
| AWS VPC Flow Logs | Network traffic metadata | Filebeat AWS module |
| Azure Activity Logs | Resource operations, sign-ins | Filebeat Azure module |
| Google Cloud Audit Logs | Admin activity, data access | Filebeat GCP module |
| Microsoft 365 | Exchange, SharePoint, Azure AD | Filebeat O365 module |
| Okta | Authentication, admin events | Filebeat Okta module |
| GitHub | Audit logs, security events | Webhook to Logstash or API polling |
How It Works
Filebeat includes modules that connect to cloud provider APIs, pull log data, and parse it into ECS-compliant formats. You configure the module with API credentials, and Filebeat handles polling, pagination, and delivery to Elasticsearch.
For some sources, you configure the cloud platform to push data to an S3 bucket or webhook endpoint, then use Filebeat or Logstash to ingest from that location.
Pros and Cons
Advantages:
- No infrastructure to manage on the cloud side
- Access to cloud-native security events you can't get otherwise
- Pre-built modules handle parsing and field mapping
- Essential for hybrid and cloud-first environments
Limitations:
- Requires API credentials with appropriate permissions
- API rate limits can affect collection completeness
- Cost implications (some cloud providers charge for log access)
- Latency between event occurrence and availability varies by platform
When to Use API-Based Collection
If your organization uses cloud infrastructure or SaaS applications, API-based collection isn't optional. AWS CloudTrail logs capture every API call in your AWS environment. Azure AD sign-in logs show authentication events across Microsoft 365. Without this data, you have blind spots in your security monitoring.
For detailed setup instructions, see our upcoming guide: Cloud Log Collection for ELK Security Monitoring.
Choosing Your Collection Strategy
Use this decision framework to determine which methods you need:
Do you have network devices (firewalls, routers, switches)? → Yes: Implement syslog collection
Do you have Linux or Windows servers to monitor? → Yes: Deploy Filebeat (Linux) and/or Winlogbeat (Windows)
Do you need file integrity monitoring? → Yes: Add Auditbeat to critical systems
Do you use AWS, Azure, GCP, or SaaS applications? → Yes: Configure API-based collection via Filebeat modules
Are you building a home lab for learning? → Start with syslog from your router/firewall, then add Filebeat on a Linux VM
Building a Layered Collection Architecture
Production security monitoring typically combines all three methods:
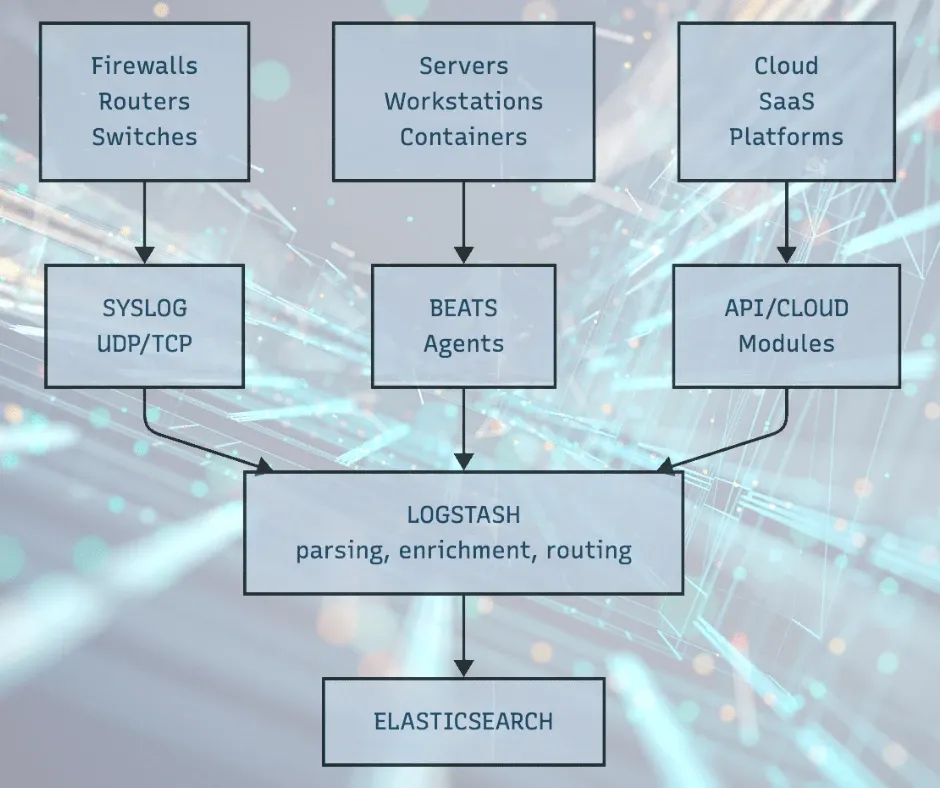
This architecture gives you:
- Network perimeter visibility from firewall and router logs
- Endpoint visibility from Beats agents on servers
- Cloud visibility from API integrations
Each layer fills gaps the others can't cover.
Data Volume Considerations
Before deploying collection at scale, estimate your log volume:
| Source Type | Typical Volume | Notes |
|---|---|---|
| Firewall (small office) | 1-5 GB/day | Depends on traffic and logging level |
| Firewall (enterprise) | 50-500 GB/day | High-traffic environments generate significant volume |
| Linux server (Filebeat) | 100 MB - 1 GB/day | Varies by application activity |
| Windows server (Winlogbeat) | 500 MB - 5 GB/day | Domain controllers generate more |
| AWS CloudTrail | 1-10 GB/day | Scales with API activity |
Your Elasticsearch cluster needs sufficient storage and indexing capacity for your expected volume. For home labs and small deployments, the Docker-based setup in our ELK tutorial handles modest volumes. Production deployments may require dedicated hardware or cloud-based Elasticsearch.
Next Steps
Now that you understand the collection landscape, choose your starting point:
- Quickest Win: Configure syslog forwarding from your firewall or router to your existing Logstash instance. You'll have real network security data flowing in minutes.
- Deepest Visibility: Deploy Filebeat on a Linux server to collect authentication logs. This gives you detailed endpoint visibility with minimal effort.
- Cloud Coverage: If you're running workloads in AWS, Azure, or GCP, configure the appropriate Filebeat module to capture cloud audit logs.
Each method builds on your existing ELK stack. Once data is flowing, you can visualize it using the techniques in our upcoming ELK Threat Detection Dashboards guide.
Summary
Log collection isn't a single solution. It's a strategy that combines agentless syslog for network devices, agent-based Beats for endpoints, and API integrations for cloud platforms. The right mix depends on your environment, but most security teams need all three.
Start simple. Get one data source flowing and verify you can search and visualize it. Then expand systematically until you have visibility across your entire attack surface.
Ready to build your security monitoring capability? Start with our ELK Stack Security Monitoring Tutorial to set up your foundation, then return here to plan your collection strategy.
If you found this article useful or had issues we welcome your feedback which will help us to improve the content.
This article is part of our ELK Security Monitoring series. Upcoming guides will cover each collection method in detail:
- Syslog Collection for ELK Security Monitoring
- Filebeat for Linux Security Logs
- Winlogbeat for Windows Event Collection
- Cloud Log Collection for ELK Security Monitoring
- ELK Threat Detection Dashboards
Key Resources:
References:
- Mordor Intelligence (2025). "Security Information and Event Management Market." Enterprise log volume and SIEM market analysis.
- Elastic (2025). "Beats: Lightweight Data Shippers." Official documentation on the Beats family of agents.
- Logz.io (2024). "Filebeat vs. Logstash: The Evolution of a Log Shipper." Comparison of log shipping approaches.


Member discussion