ELK Stack Security Monitoring Tutorial: Setup, Threat Detection & Real-World Configuration
Quick Overview
- What You'll Learn: How to setup ELK Stack for security monitoring using Docker
- Time Required: 30-45 minutes
- Skill Level: Intermediate
- Key Outcomes: Real-time security dashboard tracking authentication failures, network activity, and system threats
- Quick Start: https://github.com/cyberdesserts/elk_stack
- Perfect for: Security engineers, DevSecOps professionals, and anyone building a home security lab for learning.
Jump to Section
What is the ELK Stack for Security Monitoring?
Setting up an ELK stack for cybersecurity monitoring gives you enterprise-grade threat detection without the enterprise price tag. ELK (Elasticsearch, Logstash, and Kibana) is a powerful open-source stack used for real-time security monitoring, log analysis, and threat detection.
I've used the ELK stack extensively for everything from honeypot monitoring to production security operations. This tutorial shows you how to setup ELK stack using Docker in under 45 minutes, complete with security telemetry scripts for Windows/Linux/Mac that track authentication failures, network threats, and suspicious file activity.
For a foundational overview of the stack and its components, see What is ELK in Cybersecurity?.
The ELK stack shares similarities with Splunk, which tends to be used in larger enterprise-grade environments for added support, ease of use, and features. However, ELK's open-source nature and flexibility make it ideal for learning, development, and even production deployments when properly configured and hardened.
The motivation behind this guide was creating something easy to follow that I can refer back to and develop over time. Having built ELK stack security monitoring solutions ranging from virtual systems and Raspberry Pi to EC2 instances, it's proved invaluable for capturing things like syslog data, especially while working on proof of concepts. There's much more you can do to harden the system before moving to production, but this provides a solid foundation to learn the basics and start experimenting.
In future articles, I'll explore more advanced data collection and analysis techniques. If you find this tutorial useful, please comment, like, and share. I'd love to hear your ideas and how you are using the ELK stack for your cybersecurity projects.
Which SIEM platform do you prefer check the feedback here.
Vanilla ELK vs. Wazuh: Which Approach Is Right?
If you're researching ELK for security, you've probably encountered Wazuh. Here's how to decide which path to take.
Wazuh is a complete open-source security platform built on top of the ELK stack. It includes pre-built agents, detection rules, compliance dashboards, and vulnerability scanning out of the box. Wazuh is the right choice when you need enterprise-grade security monitoring with minimal custom development.
Vanilla ELK (this tutorial) gives you direct control over every component. You write your own telemetry collection, define your own parsing rules, and build dashboards from scratch. This approach is ideal for:
- Learning how SIEM systems actually work under the hood
- Building lightweight, custom monitoring for specific use cases
- Integrating with existing tools that already generate logs
- Environments where you need maximum flexibility over predefined rules
Think of it this way: Wazuh is like buying a pre-built gaming PC. Vanilla ELK is building your own from components. Both get you to the same destination, but you learn different things along the way.
This tutorial focuses on vanilla ELK because understanding the fundamentals makes you better at using any SIEM platform, including Wazuh, Splunk, or commercial solutions.
Is ELK Stack a SIEM?
The short answer: it depends on how you configure it.
ELK Stack is a log management and analytics platform. Out of the box, it collects, indexes, and visualises log data. That is not the same as a SIEM. A SIEM adds correlation rules, automated alerting, compliance reporting, and threat intelligence integration on top of raw log storage.
ELK becomes a SIEM with proper configuration. Add detection logic through Watcher or custom alerting scripts, enrich logs with threat intelligence feeds, and build dashboards that surface anomalies rather than just raw data, and you have a functional SIEM. Many security teams run ELK as their primary SIEM for exactly this reason: the flexibility to define detection logic for their own environment, rather than relying on vendor-defined rules.
The distinction matters when you are scoping a deployment. ELK requires more engineering effort than a commercial SIEM out of the box. The payoff is lower cost and greater control. This tutorial builds the foundation. The alerting and correlation capabilities that complete the SIEM picture are covered in the Creating ELK Stack Alerts section below.
What You'll Build: A Security Monitoring Dashboard
We'll build a practical cybersecurity monitoring solution using the ELK stack running on Docker, with custom telemetry collection scripts for Linux, Windows, and macOS. By the end, you'll have a functioning security monitoring dashboard that collects real-time data about:
- Authentication failures and login attempts
- Network activity and connections
- System load and resource usage
- File system changes in sensitive directories
- Process monitoring for suspicious activity
Core Components of Your ELK Stack Security Monitoring System
- Elasticsearch: Stores and indexes your security telemetry data
- Logstash: Processes and parses syslog data from your security scripts
- Kibana: Visualises security metrics and creates interactive dashboards
- Custom telemetry scripts: Collects security indicators from Linux, Windows, or macOS in real-time
The entire ELK stack runs locally using Docker Compose, making it perfect for development, testing, or small-scale deployments. You can use Docker Desktop on Windows or Mac to get started, even better if you have an old device you can repurpose.
Prerequisites for Setting Up ELK Stack
Before we begin this ELK stack tutorial, make sure you have:
- Docker installed and running (see deployment options below)
- Basic command line knowledge
- curl and netcat (nc) available (standard on macOS/Linux, or use PowerShell on Windows)
- Administrator access for privileged port binding
- Visual Studio Code or your preferred editor (optional but recommended)
- AI coding assistant like Claude Code (helpful for testing and troubleshooting)
Hardware Requirements
The ELK stack is memory-hungry, particularly Elasticsearch. Here are the minimum and recommended specs:
Minimum (Testing/Learning):
- RAM: 4GB (tight, but workable with reduced heap settings)
- CPU: 2 cores
- Disk: 20GB free space
- Note: You'll need to reduce Elasticsearch memory to 512MB in docker-compose.yml
Recommended (Home Lab):
- RAM: 8GB
- CPU: 4 cores
- Disk: 50GB+ SSD (log data grows quickly)
- Note: Default 1GB Elasticsearch heap works well
Comfortable (Multiple Log Sources):
- RAM: 16GB+
- CPU: 4+ cores
- Disk: 100GB+ SSD
- Note: Can increase Elasticsearch heap to 2-4GB for better performance
If you're repurposing old hardware, prioritise RAM over CPU speed. An old i5 with 8GB RAM will outperform a newer machine with only 4GB for this workload.
Docker Desktop users: Ensure Docker Desktop is allocated sufficient memory in Settings → Resources. The default 2GB is not enough; allocate at least 4GB.
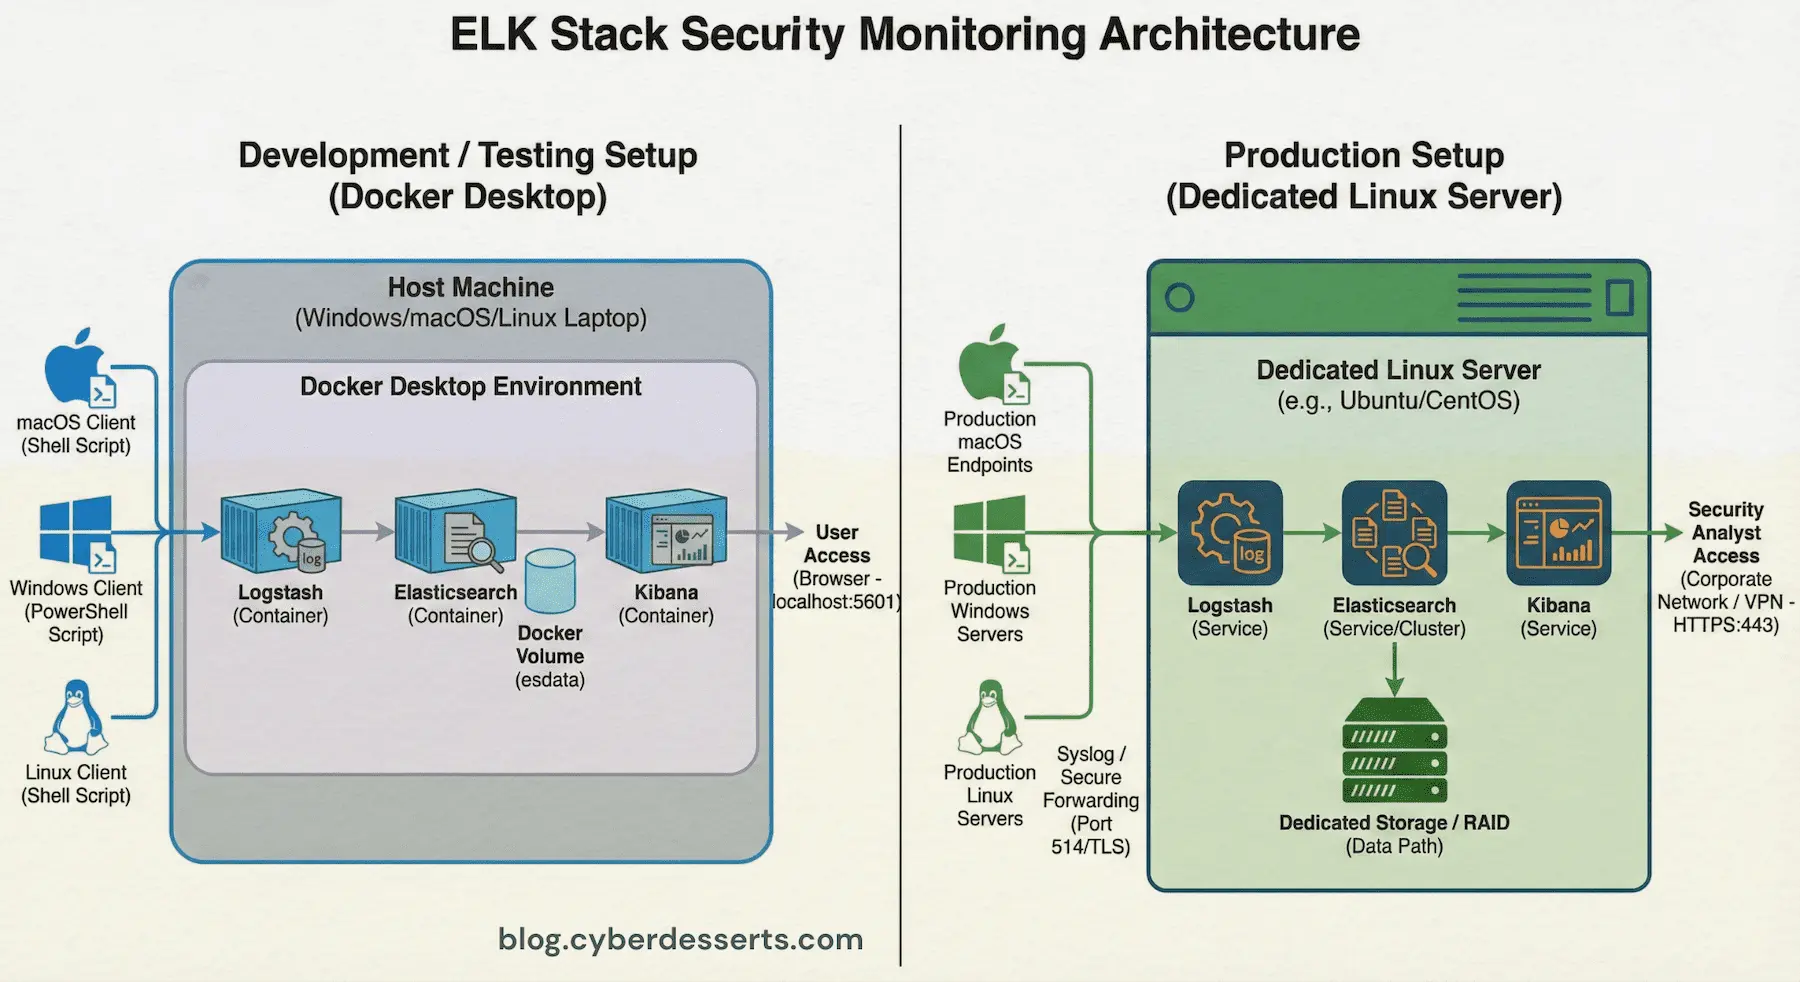
Deployment Options: Docker Desktop vs. Dedicated Linux Server
You have two main options for running your ELK stack:
Option 1: Docker Desktop (Quickest Start)
Install Docker Desktop on your existing Windows or Mac machine. This is the fastest way to get started and works well for learning and light testing. Your ELK stack runs alongside your normal applications.
- Best for: Quick experimentation, following this tutorial
- Drawback: Competes for resources with your daily apps
Option 2: Dedicated Linux Server (Recommended for Ongoing Use)
Repurpose an old laptop, desktop, or mini PC as a dedicated ELK server running Ubuntu Server or Debian. This approach offers several advantages:
- Runs 24/7 without impacting your main workstation
- Better performance (no Docker Desktop overhead)
- Can collect logs from multiple machines across your network
- More realistic production-like environment
To set up Docker on a dedicated Linux server:
# Ubuntu/Debian - Install Docker Engine (not Docker Desktop)
sudo apt update
sudo apt install -y docker.io docker-compose-v2

# Add your user to the docker group (avoids needing sudo)
sudo usermod -aG docker $USER

# Log out and back in, then verify
docker --version
docker compose version
Old hardware works fine for learning. That old laptop from 2015 under the desk ? Perfect for a home security lab.
Which should you choose?
Start with Docker Desktop to follow this tutorial and confirm everything works. Once you're comfortable with the ELK stack, consider migrating to a dedicated Linux server for always-on monitoring. The Docker Compose configuration works identically on both.
How to Setup ELK Stack with Docker (Step-by-Step)
Quick Start
You can access all project files and documentation on Github and save a bunch of time. For completeness I have documented the code here and added detailed instructions in the Github project.
Docker Compose Configuration for ELK Stack
First, let's create our ELK stack using Docker Compose. This configuration sets up all three components with proper networking and persistence.
Clone the repo:
git clone https://github.com/cyberdesserts/elk_stack
cd ELK-Docker
If cloning the repo, go to the section below: Starting Your ELK Stack Security Monitoring System
Or manually create the files with these steps...
Save this as docker-compose.yml in your project's root folder:
version: "3.8"

services:
  es01:
    image: docker.elastic.co/elasticsearch/elasticsearch-wolfi:9.1.3
    container_name: es01
    environment:
      - discovery.type=single-node
      - xpack.security.enabled=false
      - "ES_JAVA_OPTS=-Xms1g -Xmx1g"
    ports:
      - "9200:9200"
    volumes:
      - esdata:/usr/share/elasticsearch/data
    networks:
      - elastic-net

  kibana01:
    image: docker.elastic.co/kibana/kibana-wolfi:9.1.3
    container_name: kibana01
    ports:
      - "5601:5601"
    environment:
      - ELASTICSEARCH_HOSTS=http://es01:9200
    depends_on:
      - es01
    networks:
      - elastic-net

  logstash01:
    image: docker.elastic.co/logstash/logstash-wolfi:9.1.3
    container_name: logstash01
    ports:
      - "514:514/tcp"
      - "514:514/udp"
    volumes:
      - ./logstash/pipeline:/usr/share/logstash/pipeline:ro
    environment:
      - "LS_JAVA_OPTS=-Xms512m -Xmx512m"
    depends_on:
      - es01
    networks:
      - elastic-net

volumes:
  esdata:
    driver: local

networks:
  elastic-net:
    driver: bridge
What this configuration does:
- Sets up Elasticsearch on port 9200 for data storage
- Configures Kibana on port 5601 for visualisation
- Establishes Logstash on port 514 for syslog data collection
- Creates persistent storage so your security logs survive container restarts
- Disables security features for learning (you'll enable these in production)
Configuring Logstash for Security Logging
Create the Logstash pipeline configuration at ./logstash/pipeline/logstash.conf:
input {
  syslog {
    port => 514
    host => "0.0.0.0"
    type => "syslog"
  }
}

filter {
  grok {
    match => {
      "message" => "%{SYSLOGTIMESTAMP:syslog_timestamp} %{SYSLOGHOST:syslog_hostname} %{DATA:syslog_program}(?:\\[%{POSINT:syslog_pid}\\])?: %{GREEDYDATA:syslog_message}"
    }
  }

  date {
    match => [ "syslog_timestamp", "MMM dd HH:mm:ss", "MMM d HH:mm:ss" ]
    target => "@timestamp"
  }
}

output {
  elasticsearch {
    hosts => ["http://es01:9200"]
    index => "syslog-%{+YYYY.MM.dd}"
  }

  stdout {
    codec => rubydebug
  }
}
This Logstash configuration:
- Accepts syslog data on port 514 (standard syslog port)
- Parses syslog messages using grok patterns
- Extracts timestamp, hostname, program name, and message content
- Sends parsed data to Elasticsearch with daily indices
- Outputs to console for debugging
Starting Your ELK Stack Security Monitoring System
# Create the logstash pipeline directory
mkdir -p ./logstash/pipeline

# Start the ELK stack (requires sudo for port 514)
sudo docker compose up -d

# Verify all containers are running
docker compose ps

# Check the logs to ensure everything started correctly
docker logs logstash01
Expected output: You should see all three containers (es01, kibana01, logstash01) in "Up" status.
Collecting Security Telemetry: Choose Your Platform
The ELK stack is platform-agnostic. Once your Docker containers are running, you can send security telemetry from Linux servers, Windows workstations, or macOS systems. Choose the script that matches the system you want to monitor.
How it works: Each script runs on the machine you want to monitor and sends telemetry via syslog to your ELK stack. Your ELK stack can run on the same machine or on a dedicated server elsewhere on your network.
All scripts collect the same core security indicators:
- Authentication Failures: Failed login attempts (brute force detection)
- Network Activity: Active TCP connections (command & control detection)
- Process Monitoring: Network-active processes (malware detection)
- File System Changes: New files in staging areas (ransomware detection)
- System Load: CPU usage patterns (crypto mining detection)
Want to collect logs from more sources beyond these scripts? Our ELK Log Collection Methods guide covers syslog forwarding from network devices, Beats agents for deeper endpoint visibility, and cloud API integrations.
Linux (Ubuntu, Debian, CentOS, RHEL)
To keep it real-world production security monitoring targets Linux servers. This script runs on the Linux system you want to monitor and sends telemetry to your ELK stack via syslog.
The script reads from standard log locations (/var/log/auth.log on Debian/Ubuntu or /var/log/secure on RHEL/CentOS). If you don't have a Linux server to monitor, spin up a virtual machine using VirtualBox, VMware, or Multipass. This gives you a realistic target to collect logs from.
Network setup: Your ELK stack can run anywhere reachable on your network. Update the HOST variable in the script to point to your ELK stack's IP address (use localhost if running everything on the same machine).
Save this as linux_telemetry.sh on your Linux server:
#!/bin/bash

# Linux Cybersecurity MVP Telemetry Script
# Works with Ubuntu, Debian, CentOS, RHEL, and other systemd distributions
#
# Usage: ./linux_telemetry.sh [ELK_HOST] [PORT]
# Examples:
#   ./linux_telemetry.sh localhost 514      # ELK on same machine
#   ./linux_telemetry.sh 192.168.1.100 514  # ELK on remote server

HOST="${1:-localhost}"
PORT="${2:-514}"
HOSTNAME=$(hostname -s)

function send_syslog() {
    local program=$1
    local message=$2
    timestamp=$(date '+%b %d %H:%M:%S')
    syslog_msg="<110>$timestamp $HOSTNAME $program: $message"
    echo "$syslog_msg" | nc -u -w 1 $HOST $PORT 2>/dev/null
    echo "Security telemetry: $program - $message"
}

echo "Collecting Linux cybersecurity telemetry..."
echo "Sending to ELK stack at $HOST:$PORT"
echo ""

# 1. Failed Login Attempts
if [ -f /var/log/auth.log ]; then
    failed_logins=$(grep -c "Failed password\|authentication failure" /var/log/auth.log 2>/dev/null)
elif [ -f /var/log/secure ]; then
    failed_logins=$(grep -c "Failed password\|authentication failure" /var/log/secure 2>/dev/null)
else
    failed_logins=$(journalctl -u sshd --since "1 hour ago" 2>/dev/null | grep -c "Failed password" || echo "0")
fi
send_syslog "auth-monitor" "Failed login attempts: $failed_logins"

# 2. Active Network Connections
active_connections=$(ss -tun state established 2>/dev/null | wc -l)
active_connections=$((active_connections > 0 ? active_connections - 1 : 0))
send_syslog "network-monitor" "Active TCP/UDP connections: $active_connections"

# 3. Processes with Network Activity
network_processes=$(ss -tunp 2>/dev/null | awk 'NR>1 {print $7}' | cut -d'"' -f2 | sort -u | wc -l)
send_syslog "process-monitor" "Processes with network activity: $network_processes"

# 4. New Files in /tmp
tmp_files=$(find /tmp -type f -mmin -60 2>/dev/null | wc -l)
send_syslog "file-monitor" "New files in /tmp last hour: $tmp_files"

# 5. System Load
load_avg=$(cat /proc/loadavg | awk '{print $1}')
send_syslog "load-monitor" "1-minute load average: $load_avg"

# 6. SSH Sessions (Linux-specific)
ssh_sessions=$(who | grep -c pts/ 2>/dev/null || echo "0")
send_syslog "session-monitor" "Active SSH sessions: $ssh_sessions"

# 7. Sudo Usage
if [ -f /var/log/auth.log ]; then
    sudo_commands=$(grep -c "sudo:" /var/log/auth.log 2>/dev/null || echo "0")
elif [ -f /var/log/secure ]; then
    sudo_commands=$(grep -c "sudo:" /var/log/secure 2>/dev/null || echo "0")
else
    sudo_commands=$(journalctl --since "1 hour ago" 2>/dev/null | grep -c "sudo:" || echo "0")
fi
send_syslog "privilege-monitor" "Sudo commands in logs: $sudo_commands"

# 8. Listening Ports
listening_ports=$(ss -tlun 2>/dev/null | wc -l)
listening_ports=$((listening_ports > 0 ? listening_ports - 1 : 0))
send_syslog "port-monitor" "Listening ports: $listening_ports"

echo ""
echo "Linux telemetry sent to ELK stack at $HOST:$PORT"
Test it manually:
# Make the script executable
chmod +x linux_telemetry.sh

# Test with ELK stack on the same machine
./linux_telemetry.sh localhost 514

# Or test with ELK stack on a remote server (replace with your ELK server's IP)
./linux_telemetry.sh 192.168.1.100 514
You should see output confirming each telemetry metric was sent. Run the script a few times manually to generate test data before checking Kibana.
Automate with cron (optional):
This step is optional for initial testing. Once you've verified data is flowing to Kibana, you can set up automated collection:
# Edit crontab
crontab -e

# Add this line to collect every 5 minutes (update the IP to match your ELK server)
*/5 * * * * /path/to/linux_telemetry.sh 192.168.1.100 514 >> /var/log/telemetry.log 2>&1
Windows (PowerShell)
This script runs on the Windows system you want to monitor and sends telemetry to your ELK stack via syslog. It requires PowerShell with administrator privileges to access Security Event Logs (Event ID 4625 for failed logins).
Network setup: Update the -TargetHost parameter to point to your ELK stack's IP address. Use localhost if Docker is running on the same Windows machine, or your ELK server's IP if it's running elsewhere on your network.
If you're running your ELK stack on a Mac or Linux machine and want to monitor a Windows system, this is the script you'll deploy to that Windows machine.
Save this as windows_telemetry.ps1 on your Windows system:
# Windows Cybersecurity MVP Telemetry Script
# Run as Administrator for full access to Security Event Logs
#
# Usage:
#   .\windows_telemetry.ps1                           # Sends to localhost:514
#   .\windows_telemetry.ps1 -TargetHost 192.168.1.100 # Sends to remote ELK server

param(
    [string]$TargetHost = "localhost",
    [int]$Port = 514
)

$hostname = $env:COMPUTERNAME

function Send-Syslog {
    param([string]$Program, [string]$Message)
    $timestamp = Get-Date -Format "MMM dd HH:mm:ss"
    $syslogMsg = "<110>$timestamp $hostname $Program`: $Message"
    try {
        $udpClient = New-Object System.Net.Sockets.UdpClient
        $bytes = [System.Text.Encoding]::ASCII.GetBytes($syslogMsg)
        $udpClient.Send($bytes, $bytes.Length, $TargetHost, $Port) | Out-Null
        $udpClient.Close()
        Write-Host "Security telemetry: $Program - $Message"
    } catch {
        Write-Error "Failed to send: $_"
    }
}

Write-Host "Collecting Windows cybersecurity telemetry..."
Write-Host "Sending to ELK stack at ${TargetHost}:${Port}"
Write-Host ""

# 1. Failed Login Attempts (Event ID 4625)
try {
    $failedLogins = (Get-WinEvent -FilterHashtable @{
        LogName='Security'; ID=4625; StartTime=(Get-Date).AddHours(-1)
    } -ErrorAction SilentlyContinue | Measure-Object).Count
    Send-Syslog "auth-monitor" "Failed login attempts last hour: $failedLogins"
} catch {
    Send-Syslog "auth-monitor" "Failed login attempts: Unable to query (run as Administrator)"
}

# 2. Active Network Connections
try {
    $activeConnections = (Get-NetTCPConnection -State Established | Measure-Object).Count
    Send-Syslog "network-monitor" "Active TCP connections: $activeConnections"
} catch {
    $activeConnections = (netstat -an | Select-String "ESTABLISHED" | Measure-Object).Count
    Send-Syslog "network-monitor" "Active TCP connections: $activeConnections"
}

# 3. Processes with Network Activity
try {
    $networkProcesses = (Get-NetTCPConnection | Group-Object OwningProcess | Measure-Object).Count
    Send-Syslog "process-monitor" "Processes with network activity: $networkProcesses"
} catch {
    $networkProcesses = (netstat -ano | Select-String "ESTABLISHED|LISTENING" |
        ForEach-Object { ($_ -split '\s+')[-1] } | Sort-Object -Unique | Measure-Object).Count
    Send-Syslog "process-monitor" "Processes with network activity: $networkProcesses"
}

# 4. New Files in Temp
try {
    $tempFiles = (Get-ChildItem -Path $env:TEMP -Recurse -File |
        Where-Object { $_.CreationTime -gt (Get-Date).AddHours(-1) } | Measure-Object).Count
    Send-Syslog "file-monitor" "New files in temp last hour: $tempFiles"
} catch {
    Send-Syslog "file-monitor" "New files in temp: Unable to scan"
}

# 5. CPU Usage
try {
    $cpuUsage = [math]::Round((Get-Counter '\Processor(_Total)\% Processor Time' `
        -SampleInterval 1 -MaxSamples 3 |
        Select-Object -ExpandProperty CounterSamples |
        Measure-Object -Property CookedValue -Average).Average, 2)
    Send-Syslog "load-monitor" "Average CPU usage: $cpuUsage%"
} catch {
    $cpuUsage = [math]::Round((Get-WmiObject -Class Win32_Processor |
        Measure-Object -Property LoadPercentage -Average).Average, 2)
    Send-Syslog "load-monitor" "Average CPU usage: $cpuUsage%"
}

Write-Host ""
Write-Host "Windows telemetry sent to ELK stack at ${TargetHost}:${Port}"
Test it manually (run as Administrator):
# Open PowerShell as Administrator

# Test with ELK stack on the same Windows machine
.\windows_telemetry.ps1

# Or test with ELK stack on a remote server (e.g., your Mac or a dedicated Linux server)
.\windows_telemetry.ps1 -TargetHost "192.168.1.100" -Port 514
You should see output confirming each telemetry metric was sent. Run the script a few times manually to generate test data before checking Kibana.
Automate with Task Scheduler (optional):
This step is optional for initial testing. Once you've verified data is flowing to Kibana, you can set up automated collection:
- Open Task Scheduler
- Create Basic Task → Name it "Security Telemetry"
- Trigger: Daily, then edit to repeat every 5 minutes
- Action: Start a program
- Program:
powershell.exe - Arguments:
-ExecutionPolicy Bypass -File C:\Scripts\windows_telemetry.ps1 -TargetHost "192.168.1.100"
Replace 192.168.1.100 with your ELK server's IP address.
macOS
This script runs on the Mac you want to monitor and sends telemetry to your ELK stack via syslog. It uses the macOS unified log system (log show command) to query authentication events.
Network setup: Update the HOST variable to point to your ELK stack's IP address. If you're running Docker Desktop on the same Mac, use localhost. If your ELK stack runs on a separate server, use that server's IP.
Common setup: Many users run their ELK stack in Docker on their Mac while also monitoring the Mac itself. In this case, use localhost as the target.
Save this as cyber_security_mvp.sh on your Mac:
#!/bin/bash

# macOS Cybersecurity MVP Telemetry Script
# Uses macOS unified logging (log show command)
#
# Usage: ./cyber_security_mvp.sh [ELK_HOST] [PORT]
# Examples:
#   ./cyber_security_mvp.sh localhost 514      # ELK running locally in Docker
#   ./cyber_security_mvp.sh 192.168.1.100 514  # ELK on remote server

HOST="${1:-localhost}"
PORT="${2:-514}"
HOSTNAME=$(hostname -s)

function send_syslog() {
    local program=$1
    local message=$2
    timestamp=$(date '+%b %d %H:%M:%S')
    syslog_msg="<110>$timestamp $HOSTNAME $program: $message"
    echo "$syslog_msg" | nc -u -w 1 $HOST $PORT
    echo "Security telemetry: $program - $message"
}

echo "Collecting macOS cybersecurity telemetry..."
echo "Sending to ELK stack at $HOST:$PORT"
echo ""

# 1. Failed Login Attempts (macOS unified log)
failed_logins=$(log show --predicate 'eventMessage contains "authentication failure"' --last 1h 2>/dev/null | wc -l | xargs)
send_syslog "auth-monitor" "Failed login attempts last hour: $failed_logins"

# 2. Active Network Connections
active_connections=$(netstat -an | grep ESTABLISHED | wc -l | xargs)
send_syslog "network-monitor" "Active TCP connections: $active_connections"

# 3. Processes with Network Activity
network_processes=$(lsof -i -n | grep -v LISTEN | wc -l | xargs)
send_syslog "process-monitor" "Processes with network activity: $network_processes"

# 4. New Files in /tmp
tmp_files=$(find /tmp -type f -mtime -1h 2>/dev/null | wc -l | xargs)
send_syslog "file-monitor" "New files in /tmp last hour: $tmp_files"

# 5. System Load
load_avg=$(uptime | awk -F'load averages:' '{print $2}' | awk '{print $1}' | xargs)
send_syslog "load-monitor" "1-minute load average: $load_avg"

echo ""
echo "macOS telemetry sent to ELK stack at $HOST:$PORT"
Test it manually:
# Make the script executable
chmod +x cyber_security_mvp.sh

# Test with ELK stack running locally in Docker Desktop
./cyber_security_mvp.sh localhost 514

# Or test with ELK stack on a remote server
./cyber_security_mvp.sh 192.168.1.100 514
You should see output confirming each telemetry metric was sent. Run the script a few times manually to generate test data before checking Kibana.
Automate with cron (optional):
This step is optional for initial testing. Once you've verified data is flowing to Kibana, you can set up automated collection using crontab:
# Edit crontab
crontab -e

# Add this line to collect every 5 minutes (update the IP if your ELK stack is remote)
*/5 * * * * /path/to/cyber_security_mvp.sh localhost 514 >> /var/log/telemetry.log 2>&1
Testing Your Security Telemetry Collection
After running the script for your platform a few times, verify data is reaching Elasticsearch:
# Check if data reached Elasticsearch (run this on the machine hosting your ELK stack)
curl "localhost:9200/syslog-$(date '+%Y.%m.%d')/_search?pretty&size=5"
You should see JSON output showing your security telemetry data has been indexed. If you see errors, check the troubleshooting section below.
Firewall note: If your ELK stack is on a separate machine, ensure port 514 (UDP) is open on that machine's firewall. On Linux, you can check with:
sudo ufw status        # Ubuntu
sudo firewall-cmd --list-ports  # CentOS/RHEL
How to Configure Kibana for Real-Time Threat Detection
Now that your ELK stack is collecting security data, let's configure Kibana to visualise and analyse it.
Creating Data Views in Kibana
- Access Kibana: Navigate to http://localhost:5601
- Go to Stack Management: Menu → Stack Management → Data Views
- Create Data View:
- Name: Security Logs
- Index pattern:
syslog-* - Timestamp field:
@timestamp - Click "Save data view to Kibana"
Viewing Your Security Data
- Navigate to Discover: Menu → Analytics → Discover
- Select your data view: Choose "Security Logs" from the dropdown
- Add useful fields as columns:
- syslog_hostname
- syslog_program
- syslog_message
- @timestamp
You should now see your security telemetry flowing in real-time!
Security-Focused Queries for Threat Detection
Use these KQL (Kibana Query Language) queries in the Discover search bar to focus on specific security events:
# Authentication failures - potential brute force attacks
syslog_program:"auth-monitor"

# High network activity - potential data exfiltration
syslog_program:"network-monitor" AND message:>50

# Suspicious file activity - potential ransomware
syslog_program:"file-monitor" AND NOT message:"0"

# High system load - potential crypto mining
syslog_program:"load-monitor" AND message:>2.0

# Combine conditions - high network + high load
syslog_program:("network-monitor" OR "load-monitor") AND message:>50
KQL
Pro tip: Save these queries as "Saved Searches" in Kibana for quick access during incident response.
Automating Security Data Collection
Once you've verified data is flowing to Kibana using manual tests, refer to the automation instructions in your platform section above to set up continuous collection via cron (Linux/macOS) or Task Scheduler (Windows).
Ensuring Data Persistence
Your security data persists across Docker restarts because we're using named volumes. However, Kibana configurations (dashboards, visualisations) will need to be recreated unless you add persistent storage for Kibana as well.
To verify data persistence:
# Stop the ELK stack
docker compose down

# Start it again
docker compose up -d

# Verify data is still there
curl "localhost:9200/_cat/indices/syslog-*?v"
You should see your indices with their document counts intact.
What Security Metrics Should You Monitor With ELK Stack?
Understanding what constitutes "normal" versus "suspicious" activity is critical for effective security monitoring with ELK stack. The metrics collected by our telemetry scripts provide a solid starting point, but they only scratch the surface of what's possible.
Here's what each metric reveals about your system's security posture.
What Each Metric Tells You
1. Failed Login Attempts
- Normal baseline: 0-2 per hour
- Suspicious threshold: >10 per hour
- Threat indicator: Potential brute force attack or password spraying
- Response: Investigate source IPs, consider temporary IP blocking
2. Active TCP Connections
- Normal baseline: 10-50 for typical usage
- Suspicious threshold: >100 connections
- Threat indicator: Potential botnet activity, data exfiltration, or DDoS
- Response: Review process list, check for unknown applications
3. Network-Active Processes
- Normal baseline: 5-20 processes
- Suspicious threshold: Sudden spikes or unknown process names
- Threat indicator: Malware with command & control communication
- Response: Identify unfamiliar processes, check against threat intelligence
4. New Files in /tmp Directory
- Normal baseline: 0-5 new files per hour
- Suspicious threshold: >20 files in short timespan
- Threat indicator: Potential ransomware staging, dropper malware
- Response: Examine file types and origins, scan with antivirus
5. System Load Average
- Normal baseline: <1.0 on most systems
- Suspicious threshold: >3.0 consistently over 15+ minutes
- Threat indicator: Crypto mining malware or resource exhaustion attack
- Response: Check top processes, investigate CPU-intensive applications
What Else Can ELK Stack Monitor? Expanding Beyond Core Telemetry
The five metrics above provide foundational visibility, but production security monitoring typically pulls data from many additional sources. Once you're comfortable with the basics, consider extending your scripts to collect telemetry from other tools and services running on your systems.
Security Tools
If you're running security software, it generates valuable logs:
- Antivirus/EDR: Scan results, quarantine events, real-time protection alerts
- Host-based firewall: Blocked connections, rule matches (iptables, Windows Firewall)
- Fail2ban: Banned IPs, jail statistics, unban events
- OSSEC/Wazuh agents: File integrity alerts, rootkit detection, policy violations
- ClamAV: Scan summaries, detected threats, database update status
Application and Service Logs
Applications often reveal security-relevant activity:
- Web servers (Apache, Nginx): 4xx/5xx errors, unusual user agents, SQL injection patterns in URLs
- SSH daemon: Accepted keys, password vs key authentication, source countries
- Database servers: Failed queries, privilege escalation attempts, unusual query patterns
- Docker/containers: Container starts/stops, image pulls, privilege escalation
- Cron/scheduled tasks: Unexpected job executions, failed jobs, new entries
Network and DNS
Network-level telemetry catches threats that endpoint monitoring misses:
- DNS queries: Requests to known malicious domains, DNS tunneling patterns, excessive NXDOMAIN responses
- Firewall logs: Dropped packets, port scans, geographic anomalies
- VPN connections: Authentication events, unusual connection times, multiple location logins
- Proxy logs: Blocked categories, data upload volumes, connections to uncategorised sites
Identity and Access
Authentication systems are prime targets:
- PAM events: All authentication attempts, session opens/closes, password changes
- Sudo logs: Commands executed with elevated privileges, denied attempts
- SSH keys: Key additions, modifications, usage patterns
- Active Directory (Windows): Group membership changes, account lockouts, Kerberos events
Cloud and Container Orchestration
If you're running cloud or container workloads:
- Kubernetes: Pod security policy violations, RBAC denials, secrets access
- AWS CloudTrail: Console logins, IAM changes, S3 bucket policy modifications
- Azure Activity Logs: Resource creation, role assignments, failed operations
Example: Extending the Linux Script
Here's how you might add a few additional metrics to the Linux telemetry script:
# Fail2ban banned IPs (if installed)
if command -v fail2ban-client &> /dev/null; then
    banned_ips=$(fail2ban-client status sshd 2>/dev/null | grep "Currently banned" | awk '{print $4}')
    send_syslog "fail2ban-monitor" "Currently banned IPs: ${banned_ips:-0}"
fi

# Docker container count (if Docker is running)
if command -v docker &> /dev/null; then
    running_containers=$(docker ps -q 2>/dev/null | wc -l)
    send_syslog "docker-monitor" "Running containers: $running_containers"
fi

# Firewall dropped packets (iptables)
if command -v iptables &> /dev/null; then
    dropped_packets=$(sudo iptables -L -v -n 2>/dev/null | grep -i drop | awk '{sum+=$1} END {print sum}')
    send_syslog "firewall-monitor" "Dropped packets: ${dropped_packets:-0}"
fi

# Recent password changes
password_changes=$(grep -c "password changed" /var/log/auth.log 2>/dev/null || echo "0")
send_syslog "password-monitor" "Password changes in log: $password_changes"

# Disk space (ransomware can fill disks rapidly)
disk_usage=$(df -h / | awk 'NR==2 {print $5}' | tr -d '%')
send_syslog "disk-monitor" "Root disk usage: ${disk_usage}%"
The key principle: if a tool generates logs or exposes metrics, you can send them to your ELK stack. Start with what you have running, then expand as your monitoring matures.
How to Establish a Security Baseline with ELK Stack
The key to effective threat detection with ELK stack security monitoring is understanding your normal baseline:
- Run your telemetry for 7 days to establish patterns
- Document typical ranges for each metric during business hours vs. off-hours
- Identify anomalies: deviations of >50% from baseline warrant investigation
- Tune your thresholds based on your environment's unique characteristics
According to NIST's Computer Security Incident Handling Guide, establishing baselines is essential for effective incident detection and response.
How to Set Up ELK Stack Alerts for Automated Threat Detection
While beyond the scope of this ELK stack tutorial, you can extend this setup with advanced alerting and correlation.
Alerting Options
- Elastic Stack Alerting (Watcher): Built-in alerting engine (requires license)
- Custom scripts with thresholds: Simple bash scripts that check Elasticsearch queries
- Integration with SIEM tools: Forward ELK data to dedicated SIEM platforms
- Webhook notifications: Send alerts to Slack, Teams, PagerDuty, or email
Advanced Capabilities to Explore
- Log correlation rules: Detect attack patterns across multiple log sources
- Threat intelligence integration: Enrich logs with IOC (Indicators of Compromise) data
- Machine learning anomaly detection: Use Elastic ML to identify unusual patterns
- MITRE ATT&CK mapping: Tag events with MITRE ATT&CK techniques
- Integration with other security tools: Connect firewalls, IDS/IPS, EDR solutions
- Detect infostealer activity: Take a look at the infostealer article for ideas
Troubleshooting Common ELK Stack Issues
ELK Stack Not Receiving Logs
Symptom: You run the telemetry script but nothing appears in Kibana.
Check 1: Verify Logstash is listening
docker exec logstash01 netstat -tlun | grep 514
Check 2: Test basic connectivity
echo "<14>$(date '+%b %d %H:%M:%S') testhost testapp: Connection test" | nc -u -w 1 localhost 514
Check 3: Watch Logstash logs for incoming data
docker logs -f logstash01
If you see your test message in the Logstash output, the pipeline is working. If not, check your firewall settings.
Check 4: Verify your script is sending data
./linux_telemetry.sh   # or your platform's script
# You should see "Security telemetry: ..." messages
Docker Connection Refused on Port 9200
Symptom: curl localhost:9200 returns "Connection refused"
Fix 1: Wait for Elasticsearch to initialize
Elasticsearch takes 30-60 seconds to start. Check status:
docker logs es01 | tail -20
Look for "started" in the output.
Fix 2: Check container health
docker ps
All three containers (es01, kibana01, logstash01) should show "Up" status.
Fix 3: Restart the stack
docker compose down
docker compose up -d
No Index Pattern in Kibana
Symptom: Kibana shows "No results found" when creating index pattern.
Cause: No data has been indexed yet. You need to send at least one log message before creating the index pattern.
Fix:
- Run the telemetry script for your platform
- Wait 5-10 seconds
- In Kibana, go to Stack Management → Index Patterns
- Create pattern:
syslog-*
Logstash Not Starting
# Check for configuration syntax errors
docker logs logstash01

# Verify config file exists and is readable
docker exec logstash01 cat /usr/share/logstash/pipeline/logstash.conf

# Common issue: Incorrect indentation in logstash.conf
# Solution: Validate syntax, ensure no tabs (use spaces)
Permission Issues with Port 514
Port 514 is a privileged port (below 1024) and requires root access:
# Solution 1: Use sudo for Docker Compose
sudo docker compose up -d

# Solution 2: Modify docker-compose.yml to use higher ports
ports:
  - "1514:514/tcp"
  - "1514:514/udp"

# Then update your script to send to port 1514
PORT="1514"
Elasticsearch Container Crashes
# Check logs for memory issues
docker logs es01

# Common issue: Insufficient memory
# Solution: Increase Docker memory allocation in Docker Desktop preferences
# Or reduce heap size in docker-compose.yml:
- "ES_JAVA_OPTS=-Xms512m -Xmx512m"
High Memory Usage
Symptom: Docker containers crash or system becomes slow.
Fix: Reduce Elasticsearch memory in docker-compose.yml:
environment:
  - "ES_JAVA_OPTS=-Xms512m -Xmx512m"  # Reduce from 1g to 512m
Then restart:
docker compose down
docker compose up -d
Data Not Persisting After Restart
# Verify named volumes are created
docker volume ls | grep esdata

# If missing, recreate with:
docker compose down
docker volume create elk-stack_esdata
docker compose up -d
Frequently Asked Questions About ELK Stack Security Monitoring
Is ELK stack good for cybersecurity?
Yes. I have used it extensively for real-time threat detection. It provides centralised logging and analysis capabilities comparable to enterprise platforms like Splunk, without the per-GB licensing costs. Many security teams run ELK as their primary SIEM or alongside commercial solutions.
It handles diverse log sources well: firewalls, intrusion detection systems, authentication logs, and application data. That makes it genuinely useful for comprehensive security monitoring rather than just a learning tool.
Is ELK Stack a SIEM?
Not out of the box, but it can function as one with the right configuration. See the full breakdown in the Is ELK Stack a SIEM? section above.
What is the difference between ELK Stack and SIEM?
ELK Stack is a log management and analytics platform. Traditional SIEM solutions add pre-built correlation rules, compliance reporting, and threat intelligence integration on top. ELK's advantage is that you define detection logic for your own environment rather than inheriting vendor assumptions. See the full comparison above.
How much does it cost to run ELK stack for security monitoring?
The ELK stack is free and open-source. Infrastructure costs are your only variable:
- Local/development: Free using Docker Desktop (this tutorial)
- Cloud VM: $5–20/month for small-scale monitoring (AWS, DigitalOcean, Linode)
- Production deployment: $100–1,000+/month depending on data volume and retention
- Enterprise scale: Thousands per month for high-volume environments with redundancy
Commercial SIEM solutions typically charge $10–100+ per GB ingested or $50,000+ annually for enterprise licences. The cost difference is significant at scale.
Can I use ELK stack for compliance logging?
Yes, across GDPR, HIPAA, PCI-DSS, SOC 2, and ISO 27001. Key capabilities include:
- Audit trails: Immutable log storage with timestamp integrity
- Retention policies: Index lifecycle management for required retention periods
- Access controls: X-Pack security features for role-based access
- Encryption: TLS in transit, encryption at rest
- Log integrity: Elasticsearch's distributed architecture prevents tampering
One important caveat: this tutorial disables security features for learning purposes. For compliance use cases, you must enable authentication, TLS encryption, and audit logging before production deployment.
How does ELK stack compare to Splunk?
ELK is open-source, free to licence, and highly customisable. It suits teams who want to control their detection logic and keep costs down. Splunk is a commercial platform with more out-of-box integrations, vendor support, and enterprise-grade training. The tradeoff is time versus money. ELK costs more to configure. Splunk costs more to licence.
In practice, many security teams run both. ELK for development and specific use cases, Splunk for production SIEM where vendor support matters.
Next Steps: Expanding ELK Stack Security Monitoring
This ELK stack tutorial provides a solid foundation for cybersecurity monitoring. You've learned how to setup ELK stack with Docker and collect real-time security telemetry. Here's how to expand your capabilities.
Expand Your Log Collection
The telemetry scripts in this tutorial are just the beginning. Production security monitoring typically combines multiple data sources:
- Network devices: Forward syslog from firewalls, routers, and switches
- Endpoint agents: Deploy Filebeat on Linux servers or Winlogbeat on Windows
- Cloud platforms: Integrate AWS CloudTrail, Azure Activity Logs, or GCP Audit Logs
See our ELK Log Collection Methods guide for detailed setup instructions on each approach.
Additional Security Metrics to Collect
- USB device insertions: Detect unauthorised hardware connections
- Process creations: Monitor for suspicious process spawning
- DNS queries: Identify command & control communication patterns
- PowerShell execution: Detect fileless malware on Windows
- SSH key changes: Monitor for credential manipulation
- Privilege escalation attempts: Track sudo/admin command usage
- Browser history: Identify phishing and malicious websites
Creating Custom Dashboards
Build specialised visualisations for different security scenarios:
- Authentication dashboard: Login failures, successful logins by source IP, geographic distribution
- Network monitoring dashboard: Connection timelines, top talkers, port usage patterns
- Threat hunting dashboard: Anomaly detection, unusual process behavior, file system changes
- Executive dashboard: High-level security metrics, trend analysis, compliance reporting
Setting Up Automated Alerting
Move beyond passive monitoring to active response:
- Threshold-based alerts: Trigger when metrics exceed baselines
- Pattern detection: Alert on specific attack signatures
- Anomaly detection: Use machine learning to identify unusual behavior
- Correlation rules: Detect multi-stage attacks across log sources
Integrating with Threat Intelligence
Enrich your security monitoring with external intelligence:
- IOC feeds: Automatically check IPs/domains against threat databases
- MITRE ATT&CK mapping: Tag events with attack techniques
- CVE correlation: Link vulnerabilities to exploitation attempts
- OSINT integration: Incorporate open-source intelligence
Hardening for Production
Before deploying to production environments:
- Enable X-Pack security: Authentication, authorisation, encryption
- Implement TLS: Encrypt all communications between ELK components
- Configure backups: Automated snapshots of your security data
- Set up high availability: Multi-node clusters for redundancy
- Implement log retention: Automated index lifecycle management
- Add audit logging: Track who accessed what security data
I'll cover these advanced topics in future articles. Subscribe to receive updates when new tutorials are published.
Repository and Code
All the code and configurations used in this ELK stack tutorial are available in the GitHub repository:
GitHub Repository: elk-cybersecurity-monitoring
The repository includes:
- Complete Docker Compose configuration
- Logstash pipeline configurations with parsing rules
- Security telemetry collection scripts for Linux, Windows, and macOS
- Additional monitoring scripts for advanced use cases
- Platform-specific setup instructions and troubleshooting guides
- Example Kibana dashboards (import ready)
Conclusion
This hands-on ELK stack tutorial demonstrates the fundamentals of cybersecurity telemetry collection and analysis. You've learned how to setup ELK stack using Docker, configure security logging pipelines, and collect real-time threat data from Linux, Windows, or macOS systems. While designed for learning and experimentation, the concepts and techniques covered here form the foundation of enterprise-grade security monitoring solutions.
The practical approach of collecting real security metrics from your own system provides invaluable experience in understanding what normal system behaviour looks like, a critical skill for effective threat detection. As you experiment with different data sources and visualisation techniques, you'll develop the expertise needed to design and implement sophisticated security monitoring solutions.
According to the CIS Controls, continuous monitoring and log management are foundational security practices. The ELK stack gives you the tools to implement these controls effectively, whether you're protecting a home lab or enterprise infrastructure.
Remember: the best way to learn cybersecurity monitoring is by doing. Start with this simple ELK stack setup, explore the data it generates, and gradually add complexity as your understanding grows. The security landscape constantly evolves, and having a solid foundation in data collection and analysis will serve you well regardless of which specific tools or platforms you use in the future.
I continue to learn about the ELK stack and appreciate feedback to improve the quality and content and try to keep this fresh. If you subscribe to the blog, this is a massive incentive for me to continue sharing more tutorials like this.
Have questions or suggestions about this ELK stack tutorial? Feel free to comment below or open an issue in the GitHub repository.
Additional Resources
- Elastic Documentation
- NIST Cybersecurity Framework
- MITRE ATT&CK Framework
- CIS Controls for Effective Cyber Defense
- Cybersecurity Career Articles
Last Updated: March 2026


Member discussion